

We want to know only “peak and bottom” of Wave but not side show of “differ with circumstance and to know only where the loss cut or profit cut is, but not panacea of all excuse.And want to be all naked prices through the Cassandra diary.And want to be convinced ourselves that tomorrow price cannot be the random theory like drunken man working but orders from disorder Bon Voyage!
Saturday, December 21, 2013
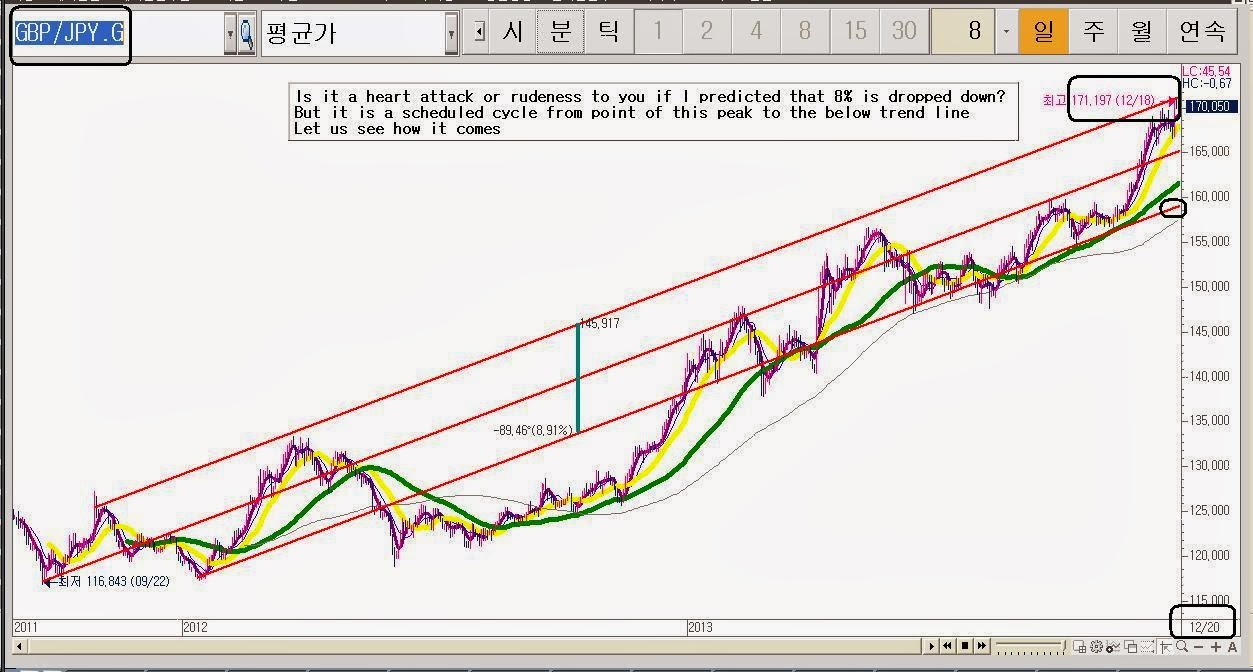
if it is rebounded after 8% reduction of Great British Pound (GBP) against Japanese Yen (GBP/JPY)
I hope you not to be distress too much from
the Cassandra words, if it is rebounded after 8% reduction of Great British
Pound (GBP) against Japanese Yen (GBP/JPY).
It cost down not only (GBP/JPY) but also its
relative items such as: EUR/JPY and USD/JPY
Friday, August 9, 2013
Today I would like to talk about USD/JPY with macro vie
Today I would like to talk about USD/JPY with
macro view
This is a long term view of it in Monthly
chart
It may be useful information for major players
rather than individual players.
Perhaps a year later you may see it what Cassandra
chart had been said.
Somehow
Briefly I diagnose it with my favorite signals
information
See below!

①
Is bullish trend line of
monthly chart but it is breakthroughs by ②
and ⑦ of down line of BBS with “V” signal
②
Is collective trend line signified
for 3 month with 3 candles. but you may be query how much it is going to be
adjusted? The answer are ③(Fibonacci adjustment) and ④( 12ma
of middle line of Bollinger bands)
③
Is Fibonacci line. We can judge with
it what strengthen of Wave will happened since it is totally depended on ratio
of it. for example
④
Is 50% of Fibonacci overlapped by
red color line of BBS middle line? If the ratio of adjustment are less than 50%
of it. you should correspond with Box theory if it is more than 50%, you may
ensure this wave is not dead and powerful. hence as time goes by let us watch
out the movement of candle whether if the candle is resisted by the red line or
not, Especially when the stochastic gold signal just like ⑥
⑤
Is stochastic (5.3.3), which we
wait for just like ⑥ (gold single)
⑥
Is stochastic triple bottom
At any rate if you are short term trader,
take a position in down trend line. Because with daily chart, it is triple top.
Furthermore if you are interested in when
it is turning into bullish phase again, please wait for the single of Double
tops after whether the previous low line (94.232) is breakthrough or not.

Monday, July 15, 2013
technique for handling “Symmetrical convergence”
Do not stingy about review and compare what
I told you yesterday
It is the result from what we expected
Eventually it is happened to the long blue
candle
And is lesson for “come down on the right
side of the fence”
I wish you to remember this technique for handling “Symmetrical
convergence”

Bog Voyage !
yours Cassandra
Friday, July 12, 2013
Let us diagnose 30 minute candle chart and make “the plan B” of EUR/USD,
This is for EUR/USD, 30 minute candle chart
Let us diagnose 30 minute candle chart and
make “the plan B”
It is decisively timing whether we go for
or pass it
If we can see long red or blue candle on
the verge of when the market is opening, Monday in Korean time, 06:35, we can
obtain the profit for it and for it’s providence
Check it out whether it is happened one of
both candle and “come down on the right side of the fence” because of below
information:

①
Is of triangle
②
Is the vertex of triangle with convergence
③
Is previous low point which we
can look open it as one of resistance line
④
Is Fibonacci adjustment which
we may judge it for upward since the rate of adjustment is above of 50%
⑤
Is red color candle what we
wish for
⑥
Is blue color candle what we which
for since this game is able to both direction
Therefor
It is totally relay upon Monday opening
price candle.
I wish you to have good luck and nice time
Yours Cassandra
Friday, July 5, 2013
About USD/JPY.
Of USD/JPY.
It is 30min Chart.
See the ①② and recognize that it is 120 ma and 240ma(moving average)
And fully comply with the trend line ③ without any rebellion
As you noticed, no sooner had the Mas
converged into the trend line ③ than the candles was up as likely
as rocket
However
For the readers of long terms investor, I would
like to advise you to keep going on it and companying with trend but to alert the
previous higher point, 103.405Yan.
If the 103.405Yan is breakout as a new
record, the Wave is not dead

Sunday, May 12, 2013

Friday, April 26, 2013
Shall we trace what happen to USD/JPY since March 8?
You may be a
mushroom millionaire if you keep it

Think about the
meaning of “Breakthrough the previous higher point”
I will be back
according with a fat wallet
Good luck
Your Odyssey Lee
Anyone a
mushroom millionaire has become?
I don’t think so
Few investors can
get profit from this usual opportunity lest they should be truly chart professional
list.
Tomorrow is too late
to study for analyzing the chart language
Today do it what
chart is twitting, ingratiating and insinuating to you
However
The above
article had been written March 8
Today it is May
30, 2013

① Is the price of march 8
(94.872 Y)
② Is the highest price of its
duration
③ Is price 98.038 Y of today
may 26
④ Is the gap 5.10% between march 8 (94.872 Y) and its peak
point 99.800
5% is not so much profit
to be enough a mushroom millionaire but
you may realize the power of chart language
Bong voyage!
Your Odyssey
Monday, March 11, 2013
Compare the result with Cassandra words of EUR/CAD
Compare the result with Cassandra words
The Cassandra has predicted about EUR/CAD
Let us review what she said and what is
wrong about her words

①
Is the level of bottom what she
was talking about 1.33506$
②
Is real happened to the peak
③
Is what she predicted
The price is reached at the level of 1.39%
between 1.33506$ and 1.35380$
The difference is 0.35% between 1.35380$
and 1.35892$ which is error of Cassandra
It will be good for you to know who is she
?
Friday, March 8, 2013
USD/JPY: You may be a mushroom millionaire if you keep it
Do not be fretting from any news but go for
your way and only your way
You may be a mushroom millionaire if you
keep it

Think about the meaning of “Breakthrough
the previous higher point”
I will be back according with a fat wallet
Good luck
Your Odyssey Lee
Thursday, March 7, 2013
The result of EUR/CAD
What is going on our plan for days swing terms?
3 days ago I posted (2013/03/04 21:03) about the deal between 1.33515 and 1.35489
And promised you that I will come back!

It is reached at the point of 1.78% within 4 days?
Indeed it is huge gap
you get the profit about 1.14% if you listen to me (prepare carefully with posted and with chart time )
What can we do now?
Wait for original price or ensure profit now?
I would like you to wait for the our original plan which is preordained by profit 1.78%
good luck
Your Odyssey Lee
한국어 사용자 보세요
3일전에 올렸던 글에 대한
결과치입니다.
과연 예측치에 도달 했나요?
아직은 100% 그 값에 오지 않았지만
80% 가격에 왔지요
매우 큰 이익 되였을 것입니다.
이쯤에서 너무 좋아라 기뻐하지 마시고
처음에 우리가 계획했던 가격까지 묻들고 가세요
성투하세요
Monday, March 4, 2013
EUR/CAD for 3 days terms
Could you be patient until it is touched on
price of 1.33515?

And deal it with a week term. I mean that you
have to wait for the price 1.35489
It is profited gap about 1.78% for swing
terms
make it sure that you must buy it between the gap price
I wish you good luck

To Korean speaker
유로와 케나디안 달러 입니다.
차트처럼 제가 마크를 그린 법위안에서 거래를 하세요
1.33515에서 구입하고 1.35489에서 매도 하는 전략을 취하셔야 합니다.
약 1.78% 수익을 목표로 하세요
Tuesday, February 19, 2013
What if the 5MA is side-way movement after 1 ~ 2days later?
This is Daily
chart of GBP/CHF.
I would like to
give you a question
What if the 5MA is side-way movement after 1 ~ 2 days later?

①
Is stochastic seeming C wave
②
Is before
candle of 6days
③
Is before candle of 5days
④
Is today candle
⑤
Is 5ma
Do you think today’s MA is turning up after
1~2 days if the price is side-way?
Monday, February 11, 2013
That is it What we expected!
That is it
What we expected!
From now on you may make a plan for buying
I wish you good luck

Sunday, February 10, 2013
About GBP/CHF you have to switch the stance owing to TREND.
Sorry!
I have been lazy about this game
We celebrate New Year festival in the lunar
calendar.
Happy new years
About GBP/CHF you have to switch the stance
owing to TREND.
The trend has been switched you must obey
it
But when?
It is question for us

Let us wait until it take a course of
retracement
I think it is too much rebounded
Please try to best to do shot the bottom of
adjustment
actual fluctuated (92.177~94075) USD/JP she said (91,314~93,820)
Do you remember what Cassandra Said ?
It will be Fluctuated between (91,314~93,820) Yen (2.22%)
of a week
however
How much has it been difference from her before and
after?
How much has it actually been fluctuated?
Let us checkup?
It has been actually fluctuated (92.177~94075) USD/JPY
But she said (91,314~93,820) USD/JPY
Can you notice the difference for weekly prediction?
A little bit error is forgivable, if we are talking about
big wave such as weekly prediction
It might be more precisely predicted if she is asked such
as daily or hour’s one

Anyway
I would like to warn you that the TREND should be shaded
way since we have been enjoy it too much
About this week prediction of fluctuation I would like to
be silence because it is confronted with meaningful point which is 91,314
Yen.USD/JPY
According to this pivotal point I wish you to make plan
for weekly project and wish you to remember the Wave theory of TREND
Bon voyage
Written in Sunday, February 10, 2013
Odyssey Lee
Wednesday, February 6, 2013
Cassandra said yesterday
Cassandra said yesterday “It is a long lane
that has no turning” or “The ebb and flow”
Was it a peak in shorter view of trading?
Cheer up!

====
Reminders!
It is real time live show
I wish you to check it posted Korean and chart time
And wish you to review from oldest posted Chart because it is reversely list up.
Thanks
Yours Odyssey Lee
Tuesday, February 5, 2013
It is the after of Cassandra USD/JPY
Do you remember Before of Cassandra?
it will be Fluctuated between (91,314~93,820) Yen (2.22%) of a week

Here
it is the after of Cassandra USD/JPY
it has been reached at 94.040 which is a little bit higher than she calculated
I think it is allowable due to Weekly Prediction
Hence you have to prepare to ensure the profit
cut since we agree with “there are lane
with no curve”
Let us see the chart about posted time and reported time

What is actually happened to GBP/CHF?
Let us compare Cassandra words “before and
after”
What is actually happened to GBP/CHF?
Has she six senses for prediction?
How did she know about rebounded point of it?
And calculated that is meant to be touched on
the previous higher point?
This is chart world

Let us see it
This is a probe of Chart in live chart
Please check the posted time of Blog and Korean
time
Be hold!
Don’t waste your all energy to know the Bloomberg
News nor economic and political situation
The real trading has nothing to do with the
neither rhetoric nor ornament, But to do with peak and valley of the Wave.
Do not listen to any news but watch out the
Chart, only the chart tell you when you must buy and when you must sell
What else you can do with such news and dazing
talk?
Forget all about economic report but close
to The Chart.
Cassandra
Monday, February 4, 2013
It nearby 1.43406 tantalizing you
Is she marvelous or fluke !
It nearby 1.43406 tantalizing you
Be patient and
Retrospect what you are
It is game for it
Otherwise hold out it

on the verge of posting it
the point is reached !
is she marvelous or fluke !
EUR/JPY should be fluctuated (123.110~128.353) Yen within a week
EUR/JPY is uptrend like GBP/JPY
You can manage it as same nature as GBP/JPY
anyway
What is be happened to EUR/JPY in this week?
Let us make a strategic assuming that It should
be fluctuated (123.110~128.353) Yen

I think it is enough information for you to handle it
Bon voyage
See what is happened to Cassandra words !
About GBP/CHF
See what is happened to Cassandra words !
Is it true what she said or a little bit difference ?
if so
what do you want to do now?
scalpers!
see the Chart again and compare the posted time and real time
and think about reason why ?
it is secret of Cassandra world

Sunday, February 3, 2013
Is it really going up there where Cassandra is predicted?
Is it really going up there where Cassandra
is predicted?
We shall see whether if she is a geek or a freak
Beforehand you must compare what she said 7
hours ago
Remember this information is not for the long term investor but scalper
Do not forget Time Frame
yours Odyssey Lee

See the marked square
Can it be touched upon 1,43422 of previous higher point?
Can it be touched upon 1,43422 of previous higher
point?
Yes
I should be at least rebounded up to 1,43422
however
please compare the items of USD/JPY
then I think you can come to it

this information never be useful for long terms view trader
but scalpers
because it is 30 minute chart of Wave inflection
Do not be shy to tell me what time frame chart you want to know
it is totally up to time frame chart regardless of methodology
the skill is the same but only time frame chart is different
it means
if you can predict 30 minute chart
you must predict daily weekly monthly chart even millennium chart
just give me any chart I will tell you according as time frame
it will be Fluctuated between (91,314~93,820) Yen (2.22%) of a week
As I mentioned before “issue and making a
sense” there are two things.
One is obvious of UPTREDN of USD/JPY
The other one is “issue and making a sense”
against the obvious one
Obey the obvious things do not play with “issue
and making a sense” Unless you are Cassandra
I wish you not to follow Cassandra words instead
of keeping going on “UPTREND”
Nevertheless Cassandra wants to be a freak
and geek
For it is attracting people’s attention because
it is interesting
Here is “the issue and making a sense” of inflection
of a week
She said that it will be Fluctuated between
(91,314~93,820) Yen
Let us see a week later again whether if
she can be enough to be a freak and geek or not
Bog voyage
Friday, February 1, 2013
Comply and Enjoy with the trend.
I would like to post those items USD/JPY and
GBP/CHF
No sooner have been opened the Forex market
than I will analysis the range of fluctuation for weeks
By the way
What is The Issue or make a sense?
When The Issue or making a sense has
something about no meaningless, It should have some meaning for issue or making
a sense
When something is too obvious to mention it,
we may be no interesting for it is no more issue and sense
For example
In chart language, Cassandra and I have been
interesting in “The INFLECTION of wave” not because all men know but because anyone
can hardly know it
We have believed that we can be snatched
from all attention from unique idea against usual things such as “USD/JPY and GBP/CHF”
for a month
As you know Cassandra chart prediction, she
has make the issue and sense, to tell you
When the chart is uptrend she mentioned inflection
of downtrend
When the chart is downtrend she mentioned
inflection of uptrend because we have believed that it is make a sense for the
issue
It means you have to respect the main TREND
but you can play with inflection if you
know.
know.

For example USD/JPY is uptrend; you must
not stance against it.
In the same way GBP/CHF is downtrend you
must not say against it, because it is power of Trend
When every Gill and Jack know it, of course,
even Dog and mouse know Power of Trend
It is useless for talking about it because
it is any longer Issue and topic
Comply and Enjoy with the trend.
Nothing can be profitable from Technical anlysist
than TREND
Be Hold!
The USD/JPY is uptrend, enjoy the trend
The GBP/CHF is down trend enjoy the trend
If you want to be a freak you can tease the
chart with inflection like Cassandra
If you not, obey with its TREND
Let us see the USD/JPY
If you obey the TREND perhaps you have
earned less money than Cassandra who would tease the inflection of Wave But
know that it is most difficult to know inflection of wave
Your police is simple as this
“Just ignore the inflection and comply with
trend after compromising with your greed”
And then the fear will not visit you “as
rust eat iron, so care eats the heart”
In same way GBP/CHF
Just comply with it’ TREND
Yours Odyssey Lee
What is The Issue or make a sense?
I would like to post those items USD/JPY and
GBP/CHF
No sooner have been opened the Forex market
than I will analysis the range of fluctuation for weeks
By the way
What is The Issue or make a sense?
When The Issue or making a sense has
something about no meaningless, It should have some meaning for issue or making
a sense
When something is too obvious to mention it,
we may be no interesting for it is no more issue and sense
For example
In chart language, Cassandra and I have been
interesting in “The INFLECTION of wave” not because all men know but because anyone
can hardly know it
We have believed that we can be snatched
from all attention from unique idea against usual things such as “USD/JPY and GBP/CHF”
for a month
As you know Cassandra chart prediction, she
has make the issue and sense, to tell you
When the chart is uptrend she mentioned inflection
of downtrend
When the chart is downtrend she mentioned
inflection of uptrend because we have believed that it is make a sense for the
issue
It means you have to respect the main TREND
but you can play with inflection if you know.
For example USD/JPY is uptrend; you must
not stance against it.
In the same way GBP/CHF is downtrend you
must not say against it, because it is power of Trend
When every Gill and Jack know it, of course,
even Dog and mouse know Power of Trend
It is useless for talking about it because
it is any longer Issue and topic
Comply and Enjoy with the trend.
Nothing can be profitable from Technical analysis than TREND
Be Hold!
The USD/JPY is uptrend, enjoy the trend
The GBP/CHF is down trend enjoy the trend
If you want to be a freak you can tease the
chart with inflection like Cassandra
If you not, obey with its TREND
Let us see the USD/JPY
If you obey the TREND perhaps you have
earned less money than Cassandra who would tease the inflection of Wave But
know that it is most difficult to know inflection of wave
Your police is simple as this
“Just ignore the inflection and comply with
trend after compromising with your greed”
And then the fear will not visit you “as
rust eat iron, so care eats the heart”
In same way GBP/CHF
Just comply with it’ TREND

Meanwhile I am afraid of misunderstanding
what I told you
It does not mean “take a Selling position” at
the verge of opening market Monday
For scalpers do not sell it because it will
be rebound as inflection
But for the day traders you must obey the
TREND
Yours Odyssey Lee
Subscribe to:
Posts (Atom)