Wednesday, January 30, 2013

Can you predict the range of GBP and CHP (GBP/CHP)?


Odyssey: Cassandra!
Can you predict the range of GBP and CHP (GBP/CHP)?”

Canssandra:
Of course!
It it up to frame chart
How long period range of price you want to know?

Odyssey:
I want to trade for scalpers
Could you tell me for a day period of timeframe?

Cassandra:
Well! At the monent in Korean time 16:10 (Thursday, January 31, 2013)
It is suppored to be range (1.44940 ~ 143476) GBP/CHP
Odyssey! Let us see what is going on

                                              
                                                            30 minute chart for  GBP/CHP in real time 


To Korean 
                                     GBP/CHP

GBP CHP의 실재시간대 가격을 말씁드리겠습니다.
오늘 하루동안의 변동폭이 될것입니다.
지금시각이 한국시간으로 16:10 (Thursday, January 31, 2013) 입니다.
하루동안이 이 녀석이 옴직일 수 있는 폭은 (1.44940 ~ 143476) GBP/CHP 사이가 되겠습니다.
그렇다면 언제 어디서 이 녀석을 잡아야 하는지 스스로 해결해 보세요
그리고 그 결과는 내일  금요일에 보지요

Tuesday, January 29, 2013

What is omen for this (USD/JPY) processing?

What is omen for this (USD/JPY)  processing? 

Is it going for 91.243 Yen (USD/JPY) which is predicted by Cassandra on monday?
If so!

What is best strategic?
I think all men can handle with this information

Bon voyage!

Yours Odyssey Lee  


To Korean

이번주 월요일 제가 예상치 글을 올려 놓았지요?

차트에 찎혀 있는데로 "Hence it should be fluctuated between (91.243~88.461) within 1 week" 입니다

그러면 우리는 이 녀석은 지금 어리로 가고 있는 것일까요?
91.243 Yen?

만약 이것이 사실이라면, 팔려고 작전을 구사했던 사람은 어디서 잘못 되였을까요?

(91.243~88.461) 사이에 등락이 된다는 정보를 가공하지 못해서?
아니면 저의 글을 못 믿어서 ?

Sunday, January 27, 2013

Is GBF/JPY stronger than USD/JPY?


Is GBP/JPY stronger than USD/JPY?

If it is feebler than USD/JPY, Can you make a plan for GBP/ USD?
Due to Failures from the previous higher point ??? 


우리는 3주 동안 USD/JPY의 추세매매를 해오고 있습니다.

그런데 GBP/JPY 에 투자하고 싶습니다.
어떻게 하면 될까요?

그렇습니다.
GBP/ USD를 비교해서 정보를 가공하여 어떤 결정을 하면 되겠군요.
따라서 오늘 실시간 차트를 오려 놓겠습니다.

Enjoy the down trend of GBF/ USD,

GBF/ USD

Enjoy the down trend of GBF/ USD, if you know what is meaning of “TREND”.
And ingratiate with him and be friend with him


By the way
As we know we have enjoyed with USD/JPY since 3 weeks

Can you filter this information with GBF/JPY?
I would like to invest GBF/JPY
If anyone knows it, tell me?

Indeed!,
You are right!
We need to filter and decide it from GBF/ USD


To Korean

우리는 3주 동안 USD/JPY의 추세매매를 해오고 있습니다.
그런데 GBF/JPY 에 투자하고 싶습니다.
어떻게 하면 될까요?

그렇습니다.
GBF/ USD를 비교해서 정보를 가공하여 어떤 결정을 하면 되겠군요.
따라서 오늘 실시간 차트를 오려 놓겠습니다.

the scope of USD/JPY between (91.842~89.741) Yen in this week.


You may calculate the scope of USD/JPY between (91.842~89.741) Yen in this week.
Today it is 90.900 Yen, Monday 10:30.

I wish you to handle this information of yourself   
After a week later (Feb 04) Let us check it out how much it is uncorrected
Good Trip!


엔화의 일주간 변동폭은?
대략 (91.842~89.741)엔 사이에서 움직여야 합니다.
이 글을 쓰고 있는 지금 이순간 월요일 10:30. 90.900 엔입니다.
그렇다면 이 숫자를 변동폭에 집어넣고 계산해보시면, 어떤 행동을 취하실지 아실 수 있겠군요.
그 이유는 제가 여기에 기법을 올리고 있으니, 참조하세요.  
성투 빕니다.    
odysseylee69@gmail.com

Friday, January 25, 2013

The trace of EUR/CHF


The trace 

of EUR/CHF


You must compare before and after of Cassandra words  what she said about it

She said that EUR/CHF has a Trend for uprising but Every flow must have its ebb”
Even if it has uptrend, it must be take a rest in the course of adjustment arrangement

Hence
     Is Jan 17 2013
     Is Jan 18 2013 at the same time please see and compare  the price
     Is lowest price in that time 1.25659
     Is highest price in that time 1.2372

I wish you to comprehended what is meaning of Every flow must have its ebb” from chart wave
Regardless of bullish phase


To Korean speaker
1 17, 18EUR/CHF에 관하여 글을 올렸습니다.
추세는 상승추세이지만, 마치 미화와 엔화 USD/JPY 처럼 달도 차면 기운다라고.

그렇습니다. 가격은 오르고 내리니까, 투자란 다른 게 아니라 
산의 계곡과 산의 봉우리를 알면 계곡에서 사서 산봉우리에 파는 게 투자입니다.

이것은 아무리 경제를 공부하고 세계정세를 잘 파악하드래도 답을 주지 않습니다. 산의 계곡과 산봉우리는 차트만이 답을 주기 때문입니다.

차트 공부 하세요
그렇지 않으면 투자 접으시고요   

Cassandra will say “Every flow must have its ebb”


It will be fluctuated “(94.000~90.000) within next week.


It is time for me to post again due to begin of the weekend and to end of weekend
I have been posted the Forex (Fx) USD/JPY for 3 week

In Marco view we can enjoy the TREND
In micro view we can enjoy “hit and run in baseball game”
I mean in the wave of Trend there are bottom and top. 

Our strategic are very plain
In the bottom we buy
In the top of it, we sell regardless of “THE TREDN”
Since we knew it as Issac Newton world An object in motion will stay in motion”
Let us remind you the Cassandra world she said “it should be fluctuated between (91.243~88.461) within 1 week”

If we can trust her words what will be happened next week (Jan 28~ Feb 1)?
Cassandra will say “Every flow must have its ebb”

Hence let us switch the position which means you must ensure the profit cut
And re-entry for selling position because it is going to be adjustment phase.

I think it will be fluctuated “(94.000~90.000). The more detailed price I will posted Monday when it is started “the race”


to the Korean
다음주 엔화와 미화는   “(94.000~90.000) 사이에서 움직일듯 합니다. 보다 정확한 숫자는 다음주 월요일 장이 시작하면 자세하게 글을 올려 놓겠습니다. 

이번주가 상승추세를 먹었다면
다음주는 하락추세를 먹어야 합니다.

주식과 FX 가 다른점의 하나가 바로 양방향 거래이기 때문입니다. 오르면 사고 내리면 팔아서 수익을 낼 수 있기 때문입니다.
물론 대세는 상승 추세입니다.
단지 변곡점을 먹자는 것이지요  


At the moment do not be hilarious as likely as pumping adrenalin


At the moment do not be hilarious as likely as pumping adrenalin


Rather you must prepare for profit cut
Next week, it will be retracement
Tomorrow in Korean time statuary I will analysis and post it for weekly plan (USD/JPY)


Do you recall what Cassandra said posted in Saturday 19 January?  
“Hence it should be fluctuated between (91.243~88.461) within 1 week


What about the before and after of Cassandra?


At the moment it is 91.197Yen  
Hence it is not corrected but error of ( 91.243-91.197=0.046) 

Have nice weekend!


일주일 단위로 엔화에 대한 미화 Forex 외환 중계를 해오고 있습니다.
저의 글을 읽고 혹시 따라서 투자를 해왔던 분들은 꽤 많은 수익을 창출했을 것입니다.
그러나 너무 기뻐 마시고 슬슬 이번 주식을 챙기시고
이번에는 엔화가 올라가니까 position을 반대로 가져가 준비를 하셔야 합니다.
오늘 금요일 저녁이니, 내일 토요일에 일주일용 엔화에 대한 분석 및 전략을 올려드리겠습니다.
즐거운 주말 보내세요
그리고 반듯이 2주 번부터 제가 중계 방송한 차트를 검토하시기 바랍니다.  

Thursday, January 24, 2013

what a price it is !


what a price it is !


I have no idea how many readers take a advantage my information
See the price what price is indicated


And compare all the Cassandra words specially from the beginning of this weekend 
Good luck 

계속 중계해오고 잇는데 얼마나 
많은 독자가 저의 정보를 유용하게 이용하는지 
문득 자문해 봅니다..

장기적으로 쭉 가세요 
성투하세요

탐욕과 이성


탐욕과 이성
차트는 어디가 저점인지 또는 고점인지 계산할 수 있습니다. 그러나 언제 이익을 실현 하는지는 또 다른 문제입니다.

혹자는 주가가 술 취한 사람 걸음걸이 같다거나 혹은 개구리 점프 방향을 맞추기 라고 합니다
그러나 이런 주장에 대하여 차트는 코 방귀를 뀌고 있습니다. 그렇지 않다는 것이지요. 저점과 고점을 알 수 있으나 실행을 시키는 것은 쉽지가 않다는 것입니다.

그렇습니다 차트의 계산은 이성의 몫 이지만,
실전에 투자하는 몫은 탐욕과 공포입니다

주식 투자가 어렵다는 이유입니다.
아무리 이성으로 가격을 계산했을지라도 실제로 실행에 옴 기기는 쉽지 않습니다.
탐욕이 이성을 지배하기 때문입니다.

저의 글을 보고 오늘 이익을 실현 시키지 못해 던 투자자 뿐만 아니라, 이 글을 쓰고 있는 사람 조차도 탐욕에 굴복 당했기 때문입니다.


무슨 뜬 금 없는 소리냐고요?
혹시 기억하세요
제가 1 6우리들제약한달 안에 34% 오른다고 글을 올렸습니다.
그것도 34% 오르면 미련 없이 도망나와 한다고 키움증권 게시판 및 팍스넷에 글을 올렸고 저의 트위터에도 올렸습니다.

그러나 실전에 행동을 취했던 사람은 몇이나 될까요?
저 역시 34% 더 오르자 (오늘 124 1170원까지 올랐음) 탐욕이 발동하였고, 굴복 당했습니다.
오늘 955원에 종가를 기록하게 되였으니까요.

우리가 정복해야 할게 기술적 분석의 공부가 아니라 바로 탐욕과 공포라는 사실을 아는 사람은 진정한 고수라고 말하고 싶습니다.  .  

Wednesday, January 23, 2013

Cheer up!


Cheer up!

And enjoy the trend again since the trend is your comrade 

Cheer up!
And enjoy the trend again since the trend is your comrade
You may make a plan not for the day but not for the weekend terms
I mean you can neglect small wave but not big wave

It is up to you
whether if you want to handle the small size of Wave or not

 I would like you not to be a scalper but a day trader

Good luck
Cassandra 

Tuesday, January 22, 2013

The Angle of rebounding is not as powerful


The Angle of rebounding is not as powerful


The Angle of rebounding is not as powerful as switching bearish TREND into bullish phase
See the yellow line of 20ma

It seems to be E wave instead of C wave (do you know the Elliott wave principle?)
If you are a scalper wait until the 20MA is turning up 
that is reason why you have to ensure first the trend 

If you are long term traders, ignore this 30 minute chart due to the trend is not dead
     Is 20 MA (Yellow line) see the angle
     Is the trend line which is Breakthrough  


20이동 평균선이 노란선입니다.
노란선의 꺽임의 각도가 매우 좋지 않지요 
반등의 힘이 매우 약하다는 것입니다

이는 30분봉상 20이평선이 C 파동이 아니라 E 파동까지 가겠다는 의미입니다.

단기 투자자는 손절 하시고 만약 사셨다면,
그렇지 않고 장기 투자자는 무시하고 가세요
왜냐하면 큰 파동은 상승추세이기 때문입니다.
봉을 먹기 보다는 추세를 먹는 분들은 이 파동은 무시하세요 

Where is trend line?


Question!

It is real time relay about USD/JPN sine 2 weeks ago
You may contrast it in terms of all view of posted time and written time

Let us study a classical technical chart language   

Where is trend line, which is based on one of Dow Theory of Trend methodology?

I want you to drill by yourself checking out not only this chart but also other all of them  

공부합시다
2 주전부터 일본 엔화와 미국 달러화에 대하여 실시간 중계방송 하고 있습니다.
지금의 실전 상황에서 공부 좀하고 넘어가지요
이 상황에서 트랜드이 어디있나요?
그 녀석이 소위 지지선 역할을 한다는 게
고전적인 다우이론 기법인데
실전에서 확인하고 가세요.

Now! The ball is on your court


Now! The ball is on your court

It is up to you whether you trust Cassandra
Or whether you ignore her perdition  
After scrutinizing all of her saying, you may decide which way you want to hit the ball
Finally! The ball is on your court  


우리가 일주일 동안 쭉욱 엔화를 주시 해왔듯이  
엔화는 강세 구간이었습니다.
, 이는 개나 소나 모두가 다 알고 있는 사실인데
이 때 우리는 강세구간에서 엔화가 떨어질 것이라고 말씀 드려왔습니다.
글을 올린 시점과 차트에 찍인 시각을 모두 확인 하시기 바랍니다.

어떻습니까?
오를 때고 그냥 오르지 않고 쉬었다가 가지요?
마찬가지로 내릴 때고 그렇습니다.

그런데 이것을 알면 고점에서 팔고 저점에서 매수가 가능할까요?
기술적 분석은 이것에 대한 답을 제시하지만, 인간 개개인의 심리 상태에 대하여는
침묵으로 일관하는 경향이 있습니다.

기술적 분석이 30%라면 심리가 70%라고 하는 이유이기도 합니다
투자란 결국 자신이 누구인지를
뒤돌아보게 할 수 있는 가장 유용한 거울이 아닌가 생각합니다.
성투하세요   

Monday, January 21, 2013

Don’t say “I can’t remember this chart”


You must snare and snatched it ruthlessly when it is touched   

If the readers of this Blog have been listen carefully to Cassandra
They must feel something from her!


What do you think about Cassandra words?

Do you think her chart is insane?
If so

I would like you to compare all about time
Time when she told you
Time when she  did write
Time when it is posted

Cheer up!


Meanwhile
Let us see this real time chart; on Air, relay  
This Target price predicted by Cassandra
You must snare and snatched it ruthlessly when it is touched    


Cassandra’s the before and after


Cassandra’s the before and after 


A man can fool some of the people all the time, and can fool all the people some-times, but he cannot fool all the people all the time.


Why don’t you call a spade a spade?
let us check out what she said!


Cassandra’s the before and after
     Is Peak price which is mentioned last weekend on Saturday
     Is expected the pullout price  
     Is the range of a week during (21 Mon~26Sat) which is 1.57% of gaps
Dear readers?
As Cassandra’s prediction last Saturday, so far so good
Today it is beginning of weekend Monday
Let us forgive her the very precise Numbers from weekly time frame chart. But remember by and large what she said that the retracement of wave will be happened within a week.
I wish you check out it carefully what is going on
And wish you careful recalculation before and after “her words comparing posted time and its record.  
Yours odyssey      

Saturday, January 19, 2013

To buy or to sell? That is only question in trading world.


To buy or to sell? That is only question in trading world.


the rest of them are rhetoric and ornament for teasing intellectual entertainment for humors
if so
what will be USD/JPN? 

If it is pullout from the peak within next week, what level of price will be?

That is Un-answerable question to sophistic anlysist even to Cassandra! 88.719 Yen

Well
With brave ignorance, she may point out that the pullout price should be 88.719 Yen

Hence it should be fluctuated between (91.243~88.461) within 1 week
We shall see how Japanese Yen will be  weaken against American dollars  


To my readers!
It is real time prediction
You may compare “Before and after” what Cassandra was talking about By means of contrasting time for example, time for update and time for writing or time for real time chart record
I wish you not to invest any money until she is proved a good fortuneteller or not 


To Korean 

다음 주 일본엔화의 이동경로를 말씀 드리겠습니다.
일주일 안에 (91.243~88.461) 사이에서 오르고 내려야 합니다
만약이 이것이 사실이라면 1주일 뿐만 아니라, 1달 혹은 1년치의 예측이 가능하다는 이야기 입니다. 아니 100년치도 가능하다는 이야기가 됩니다. 만약의 차트분석이 효용이 있다면 말이지요
과연 주가는 술 취한 사람의 걸음걸이와 같아서 인간이 알 수 없는 것인지 우리 한번 확인 해보지요 

그러나 실제로는 100년을 대상으로 증명할 수는 없어서 단지 1주일로 증명을 시도 합니다. 같은 이유로 30분도 가능하겠지요.

Strategy about USD/JPY for Next Week


Strategy about USD/JPY for Next Week


What does she say about USD/JPY for Next Week (2013/01/20~2013/01/27)?

Be hold!“There is a long lane that has no turning.”


If you enjoy, so far so good, the TREND of it,
I wish you to take a rest or to take a reversal position
Because it is going to take a process of the adjustment of wave   

Well!
We shall see whether she is right or wrong after 1 week later 

달도 차면 저문다고 다음주에서는 엔화는 (USD/JPY) 조정을 받을 것입니다.
 지금까지 수익 나신 분들께서는 한번 털어 주시고 가세요.
이 글을 쓰고 있는 시각이 토요일이니까, 90.079에 마감되었습니다
이를 차트에서 확인이 가능하겠군요
그러나 1주일 후에는 다시 정확하게 121일부터는 다시 상승추세를 이어갈 것입니다.
외환 거래는 주식과 달라서 양방향 거래가 가능하니까, 이 정보를 잘 활용하시기 바랍니다.


Friday, January 18, 2013

Why EUR is stronger than Swiss Franc?


 Why EUR is stronger than Swiss Franc?


Of this question I am capable of diluting the true of it
Such as EUR and Swiss economic issue as well as political issue
but I hate to do this
Let us get to the point 

To the technical anlysist,
 it seem to be absurd for consuming our energy if I do abuse my dazzling tongue 

For those are too many facts for us to be digested and comprehended
Perhaps technical anlysist may strongly insist his language instead of immense factor all of world

Let us eager to listen to his language, chart (Jan 2013 18)

This is monthly chart of EUR/CHF
This is brief answer of all the state EUR/CHF with very concise explanation.
To the general Readers, it may be seems Greek!
It is one of attribution of Bollinger Bands (BBS) which is fulfilled as contraction and dispersion(or divergence)  
     Is stochastic divergence
     Is BBS which is at the verge of Opening mouth
Black line is BBS Up lines and Red line is middle line of it
It was utmost contraction
It is at the verge of opening.

Hence
Technical analyst will answer you, pointing out this BBS, “the chart is implied all about Europe and Swiss economic situation in chart world.   

To my readers!
This information will profitable within one or two months
If you don’t know what is meaning of Monthly chart (time sequence)   


To the Korean speaker


유로가 스위스 프랑에 강세를 보이고 있습니다.
그 이유를 유럽의 정치경제에서 찾기 보다는 기술적 분석상의 차트 언어로써 찾아야 합니다. 그렇지 않으면 우리가 소화할 수 없는 다량의 정보를 취득하고 가공하여야 하는데 개인으로써 불가능에 가까운 일이니까요
우리는 혓바닥이 현란한 경제학자나 혹은 분석가 보다는 오히려 차트 분석가로부터 그 답을 찾아야 합니다.
? 유로가 스위스 프랑에 강세를 보이고 있는가?  
차트는 거두절미하고, 얻고자 하는 답을 매우 간단하게 도출하기 때문입니다.    

차트는 볼린저밴드입니다.
볼린저밴드의 속성상 차트가 응축되고 확장되는데, 지금의 차트를 보시면 최대로 수축되었고
지금 막 확장 단계에 들 어 서는 것을 확인 하실 수 있습니다.
이것은 월봉 차트이니까 최소한 2~3개월은 투자를 하셔도 손해는 보지 않은 다는 정보입니다.
성공적인 투자바랍니다

The result of Cassandra words


The result of Cassandra words
What if you listen to Cassandra word carefully?
Is it nightmare or Gospel?
Let us compare how it was and what it is

Because it is power of re-treatment  
See
     Is warring point
     Top point
     Retreatment (pull back) price
     Is price level of lower
     Is price level of peak 

 Before of EUR/CHF

Do you remember what she told “you do not rush?”  
She suggested price of retreatment when it is down


Monthly chart of DAX index


Monthly chart of DAX index


It seems hard time to be up to the level of (# 8022)
And will be pivotal issue when it is reached at the previous level of Dax (# 8022) because it is strongly acted by mean of resistance line 
Good luck !

Thursday, January 17, 2013

OF EUR/CHF


In first chapter If you don’t know any lines on chart language, never mind, you will be gradually intimacy what is and how to read it. This is my final goal to be reached at though this progress in introduction chart.
But I am strongly insisting on that you must see first the account how is increasing. Tempting enough let us eager to listen what chart is telling us, and examined the lowest point well and truly, if not, let us turn away from my chart language unless the reason and logic has failed to guide and persuade you there.            
I want my readers to share this horrible fear with my chart. It will be huge advance in this field, if someone feels tragedy drama from chart; I think not less than 5 % of trades can feel how candle is sung and dance. hence  I adapt “on air ,live scene, how I strife for survivable , from the chart , feeling the uneasy,  suffer or agony , it is almost near to goals, thou, chart language is too difficult to decipher , if you feel it, it means you understand and listen to what chart is telling to you about good and bad news. Perhaps this is best way for readers to lick my brain and heard my heart beating throughout live show of battle (I name on it as air live scene from the battle)  This may work, yes, as a narrative in the first chapter partly, and rest of them, Continued last chapter. If you don’t want to disconnect the story, you can directly skip to chapter 13 


let us see real time chart and feel it 

                                   Eur/Chf

It is 30 M chart that we consider whether if it is peak or not
In day trading, you may consider that it is the top of short term view   
As real time of it, the price is 1.24372 you would better sell it
And after re-buy it for long term view
Let us see how Cassandra words are precise!


30분봉 차트입니다.
단기적으로 한번 털어주고 다시 잡아도 좋다고 생각합니다.
왜냐하면 장기적으로는 상승추세이니까요
그러나 상승추세일지라도 눌렀다 가는 게 chart 입니다. 즉 오를 때 조차도 내렸다가 가는 곳이 있는데 소위 눌림목이 되겠군요. 이 종목은 30분봉상 한번 눌렀다가 갈 것입니다.
우리 한번 주시하고 그 결과를 비교해보지요
카산드라의 예언을 믿어도 되는지

Two weeks ago I predicted it (Dow Jons) as blue

I would like to revise my options (I hope it is not too late) because of Double bottom of stochastic signal 
Sorry about it !
See the ① of “W” pattern so called ‘double bottom’
   And   ② of BBS as the beginning of dynamic stage (opening mouth) two thick black lines   


Hence give me 1 month more 
I will give you more confirmed information 
sorry again


The result of Cassandra words


What if you listen to Cassandra word carefully?
Is it nightmare or Gospel?
Let us compare how it was and what it is
Because it is power of Trend
Hence let us strip up her secret how she predicted 3.43% profits within a week   
   
                                          1. Real time of USD/JPY


Do you remember what she told you?
She suggested price of 120ma in 75M chart when it is going up 

                                      2. A Week ago of USD/JPY


                                 3. Strip of Cassandra words


What are the secrets of her knowledge?
How she could predicted the price if it is matter of drunken man walking as a random theory?
Because she knew the trend as Issac Newton
An object in motion will stay in motion” 
so called Ladder pattern 


It may well be regarded as a distorted rectangle not only of characteristic behavior but also of Psychological status. 
All Main concepts from the pattern are finding out common element by inductive logic, since all substance is same as rectangle pattern.
 in especially ⑧&⑩ points are shared with resisted line of 75MA, the more intersection of facts, the more you can ensure the possibility  


More about Ladder pattern 

We often heard the ‘one sparrow don’t make a summer’ it is very best explanation of ‘Trend, it means in chart trading we are able to enjoy the weather of springing, mayday of life. For one sparrow can’t switch “the Trend of spring” into especially in weather of summer. It is power of trend and power of the inertia in Issac Newton world “An object in motion will stay in motion”    


I was about to create a chapter about “sparrow and trend” For it is very good example of explanation of” “TREND" since the meaning of “TREND" is so essential to technical anlysist filed. It is one of advantage which the fundamentalist can’t get it.  

Meanwhile
Assailed with doubt, how do we know about the period of trend in chart but not in season? 
Whereas we have known already about prior knowledge what is meaning of spring and summer and season and also have known that each season is consisted 3 month period.

It is question for us.  Even if one sparrow doesn’t make a summer’ we know when the summer is coming. In season it will be presumably within maximum of 3 month, the summer coming at least. But in chart how do we know the length and duration of trend?

It is one of our final tasks to synchronize the sensation between a sparrow in season and a trend in chart
If we can truly sense what is meaning of a summer or springing in season as like as we can feel it in chart, it is one of best and lucrative deal what we can harvest from the skill of chart.
I may reissue this topic “sparrow and trend”  

At the moment I want you to partly satisfy with the trend as below 
Thicken black line is upper line of BBS
Thicken Red line is middle line of BBS
BBS is another expression of ladder pattern especially the red line has substantially same function of trend.  

As mention before, You may recognize this is acted as same mission with same function of Resistance & supporting line as well as of one Traditional trend lines (14) because they are intersected by both conception. It is nothing but just a matter of angle from which side you can approach here.  


It is trend of BBS and of ladder pattern, too.

We can enjoy the party until the trend is collapsed with double tops’” signals ( which is  inverted pattern of “W” of course it is better if we can company with negative divergence from any indicators)

Those BBS trend between upper and middle lines has more significant power than normal trend line which you may draw as this. It is doubtlessly acted as Resistance & supporting line as well as one of traditional trend line.  

You can decline the degree of angle and see as attribution to rectangle.
The methodology of trend has been fulfilled long time since Dow Jons. Even nowadays many of analysts take advantage of this function as the trend [1]in chart language, which is neither inclination nor constancy but an object in motion in motion in Issac Newton world.

As you can see the No ~No has been busy for his mission for embracing inside of a ladder (ref. Ladder pattern chapter)

See the No and No   
Both of downtrend line and BBS of down line are breakthrough and strongly supported by BBS down line. Interpret that when such a case especially the BBS and Ladder pattern is overlapping it. They are coworkers as common interested. 
Here of BBS of Middle line and downtrend of ladder is shared with their job. You can see this as bullish phase. In my chart it is expressed by blue background color as you know.

When it is breakthrough, where is it also rebounded?
When is best time to enter here?
The once resistance will be recoiled as supported line. The support will switched as resisted

Hence It will be rebounded to the No which his function has been changed from support into resistance line with 70% personal statistic.

I wish you to expend and enlarge this fact not only into this ladder pattern but also into analogous pattern such as rectangle, flag, Wedge and all of triangle. I mean “all “ it is substantially same same but different.
And I wish you to inflate like popcorn those facts with confluence of other indicators for best timing for entry as well 


It is same trend as previous one but more clearly we can observe inside of story.


                        =                       

I have a question, What if it is not rectangle but flag pattern where post is as the upside down pattern of the flag?

We can artificially decline ladder pattern as above and can similarly interpret this pattern as rectangle Pattern in terms of psychological struggle story between a bull and a bear world. 

When you find out some of this pattern as the trend, it does not always guaranty you to earn the money but you have some reason to enter at least. This is one of our final missions for feeling it.  

It may be small difference in stock trading but it is big difference in technical analysis unlike fundamental analysis. It will be too luxury to apply to the fundamental analysis here in world of Forex trading.

This is reason why we classify all the patterns in the light of conception from the fractal geometry  to obtain the more possibility in chart language as well as We may access to here in this pattern as a tools of logic of induction theory.

When you see such a ladder pattern, you can think about entering at the No but not uptrend of it otherwise your psychology will fret and erosive and suppressed by emotional decision.

It is apparently at the moment just two intersection of them the point is confluence both by one of 14 trend patterns and BBS line. But you may see the more meaningful intersection as progressing of this book. I want you to not have objection that the more intersection of patterns the more possibility. But I want you to acquire and you to better arm with statistics since we can see as much as we know.


Who said the most easest things is advise some one and most difficut things is vitory in argument from ignorent one. Perhap I am doing same things, for in fact It is not easy for us to apply it in real trading because the chart is only displayed  after result. But before result it is not same matterns. Hence it is easest thing for me  to adive you that i can justy the logic only according as what is actural happened.
It is hapeend as often as eathing rice on korean breakefast and as often as I am poorly betrayed it is too bad trauma to cure it.

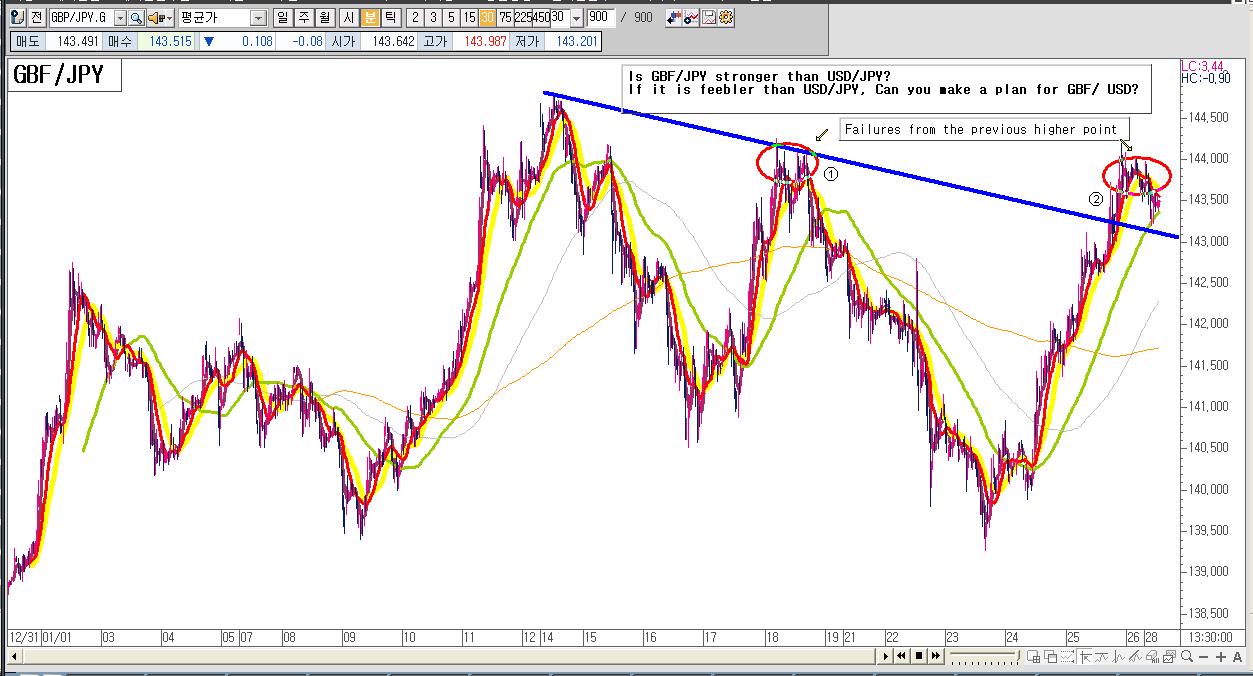
Let us see this chart. we know where was best point. But before result, we are humman, too humman
However Undountley you know where is hunting point as this  
     Is ideal point again
     But I had entered 2 ,for it had provided several reason to bet ; it breakout the previous higer point , C wave and chair pattern even more, but it entirely betraied  all the probability. If we are not armed with stop loss, do not foret that we are completely forlorn
     Is frist ideal point but I could not expect to be became status of from view point of
I have sad vistory with bad result.
I did it with stop loss. The lessen fee is incalculable not only material but psychological issue
We call it bad trauma. Hence in chart world, keep in mind that We absolutely cannot get along without stop loss. I mean not only this pattern in chapter but also all of loweret point in all chapter