Friday, July 12, 2013

Let us diagnose 30 minute candle chart and make “the plan B” of EUR/USD,

This is for EUR/USD, 30 minute candle chart
Let us diagnose 30 minute candle chart and make “the plan B”
It is decisively timing whether we go for or pass it
If we can see long red or blue candle on the verge of when the market is opening, Monday in Korean time, 06:35, we can obtain the profit for it and for it’s providence
Check it out whether it is happened one of both candle and “come down on the right side of the fence” because of below information:

     Is of triangle
     Is the  vertex of triangle with convergence
     Is previous low point which we can look open it as one of resistance line
     Is Fibonacci adjustment which we may judge it for upward since the rate of adjustment is above of 50%
     Is red color candle what we wish for
     Is blue color candle what we which for  since this game is able to both direction
Therefor
It is totally relay upon Monday opening price candle.
I wish you to have good luck and nice time

Yours Cassandra      

Friday, July 5, 2013

About USD/JPY.

Of USD/JPY.
It is 30min Chart.
See the ①② and recognize that it is 120 ma and 240ma(moving average)
And fully comply with the trend line without any rebellion
As you noticed, no sooner had the Mas converged into the trend line ③ than the candles was up as likely as rocket
However
For the readers of long terms investor, I would like to advise you to keep going on it and companying with trend but to alert the previous higher point, 103.405Yan.

If the 103.405Yan is breakout as a new record, the Wave is not dead      


Friday, April 26, 2013

Shall we trace what happen to USD/JPY since March 8?


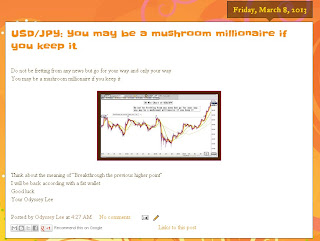
Do not be fretting from any news but go for your way and only your way 
You may be a mushroom millionaire if you keep it


Think about the meaning of “Breakthrough the previous higher point”
I will be back according with a fat wallet
Good luck
Your Odyssey Lee    


Anyone a mushroom millionaire has become?
I don’t think so
Few investors can get profit from this usual opportunity lest they should be truly chart professional list.

Tomorrow is too late to study for analyzing the chart language
Today do it what chart is twitting, ingratiating and insinuating to you     


However
The above article had been written March 8
Today it is May 30, 2013
Shall we trace what happen to USD/JPY since March 8?


  Is the price of march 8 (94.872 Y)
  Is the highest price of its duration   
  Is price 98.038 Y of today may 26
  Is the gap  5.10% between march 8 (94.872 Y) and its peak point 99.800
5% is not so much profit to be enough  a mushroom millionaire but you may realize the power of chart language
Bong voyage!
Your Odyssey