Showing posts with label USD/JPY. Show all posts

Saturday, February 7, 2015

One year later of USD/JPY (IV)

One year later of USD/JPY (IV)
  

  It seems to be progressed by the CORECTIVE wave for the time being, more than a half year even a year.
You would better take a positon only for downtrend for 6~12 months after that
It seems rebound again for uptrend
And means that the macro view of the wave in monthly chart scale is not dead rather keeping going on the uptrend
For 6 month I wish you not to expect it is going to “UP”
Today’s issue are, if so, what the level of price will be supported?
Yes!
It is a meaningful question
The answer is the 10 ma ( 10 month moving average line)
Let us see more details about the chart   


Monthly chart of USD/JPY


     is “V” signal of Bollinger band which I recommend you to wait. Now it is the shape of what I expected
     is the dead cross signal of Stochastic I recommend you to wait. Now it is the shape of what I expected but insufficient ( I have required the bellow 80% of the overbought)  
     is 1 or 3 impulse wave ( never mind!  It is only “name it”)
     is 3 or 5 impulse wave ( never mind!  It is only “name it”) but the most meaningful of the③ and ④ are not just name. Rather it is a significant of “the size of wave and it’s equivalently copy of the wave, so to speak, it is proportional size of “③ = ④” Don’t you think it is not same size of the wave? And then it is not reasonable conclusion of the corrective wave?
     is the 10 month moving average(10ma) which should be acted as supported line when it is the end of corrective wave     

see more details of it and comprehend it’s history of my blog

Von voyage!


Friday, December 12, 2014

One year later of USD/JPY (III)

One year later of
USD/JPY (III)

This subject is interlinked with http://odysseylee69.blog.me/220182757136
And is reissued until when we can enjoy “its trend”?
On the contrary, when is it stopped and corrective wave again? Since It is only question whether we clear the position or keep on it.(for I told you a year ago the best time to clear the position)
I think it is nearest to such a termination for a prudential strategic  
 
At the moment the US dollar against Japanese Yen (USD/JPY) is indicated as 118.772 (Yen).
For retrospection of what chart have been posted of this issue since more than 1 year
And review and scrutinized what I said truly and well.
Please watch it attentively whether if the signals are appeared or not    
However this is another monthly chart and another viewed to be deciphered but mostly it is same conception as previous chart   
         

Monthly chart of USD/JPY


     is perhaps to be said an impulse wave ( either 1 or 3 waves, apparently more like 3 waves ) as an Elliott followers would called it. But I dislike its theory since there are immense exceptions and so many differences with circumstance for sophisticated excuse.
     is 5 waves (if so, first wave is the 1 wave). but you may well forget Elliott principal wave theory since it is to me “the humor of Scholars” but what I want to say here, it is often enough to be happened, calling as “the rule of equivalent length” just as the size of ①=②, if so, we are near to switch the positon because it should be stopped somewhere around here.    
     is previous high point ( more or less 123. Yen). This is the point where is overlapped with maximum wave size of ①, so that we need to prepare to clear the positon
     is stochastic which should be confluence with Bollinger bands “V” signal
     is Bollinger bands’ down line which should be occurred as bands signal “V”
     is an example of the “V” signal just before you, which should be kept eyes on for the confluence as the same ⑥=⑦ as ④=⑤
Anyway watch out it very attentively with those signals

and von voyage!   

Saturday, November 15, 2014

One year later of USD/JPY

One year later of

USD/JPY


It has been a long journey of USD JPY in almost 10 Blogs
Traced what Cassandra said to you by the reversal process of the posted sequence, you may find out the accordance with the entire phrase.  

But I doubt that anyone scarcely has been kept on it and become a mushroom billionaire?!
Even now it will be not too late to respect and obey its trend and never defiance like young rebellions against a currency of Japanese Yen


Monthly chart of USD/JPY


More details you may see which Cassandra in just previous a blog, answered about the issue of “until when” if you keep it?

      is down line of Bollinger bands which is supposed to tell you best timing as “V” signal when you sell it and run away  
      is stochastic signal which you wait for the Dead Cross
      is down line of Bollinger bands which is supposed to be happened to the same single of “V” as (so that it will be a “Signal as =)
      is stochastic signal which you wait for inside of as the same signal as the Dead Cross (so that it will be a “Signal as =)
Because those idea has same relationship and attribution just as = so =


Yes!
It may be better to repeat the same sentence.

-         Enjoy its monthly chart trend but not defiance against the trend since “one swallow doesn't make a summer”-

Hence
I wish you to trace all the records what had been posted 


Bon voyage!


Friday, September 12, 2014

One year later of USD/JPY


One year later of

USD/JPY


Has anyone become a mushroom millionaire?
Since I told you a year ago USD JPY “You may be a mushroom millionaire if you keep it”
Refer 2) and click all related topics as below
And then you will see what Cassandra said
And then you may trust her what she will say for Next strategic  


     is a year ago candle August 2013
     is a year later price 107 Yen and the gap is ranged (100~107), 7%
     is double top signal why you would better keep going on


Until when?
Yes!
Enjoy its monthly chart trend but not defiance against the trend since “one swallow doesn't make a summer”
Hence

Wait for the double top which is a shape of reversal signal of ③ (Double bottom) 

Friday, August 9, 2013

Today I would like to talk about USD/JPY with macro vie

Today I would like to talk about USD/JPY with macro view
This is a long term view of it in Monthly chart
It may be useful information for major players rather than individual players.
Perhaps a year later you may see it what Cassandra chart had been said.   
Somehow  
Briefly I diagnose it with my favorite signals information
See below!  


     Is bullish trend line of monthly chart but it is breakthroughs by ② and ⑦ of down line of BBS with “V” signal
     Is collective trend line signified for 3 month with 3 candles. but you may be query how much it is going to be adjusted? The answer are ③(Fibonacci adjustment) and ④( 12ma of middle line of Bollinger bands)
     Is Fibonacci line. We can judge with it what strengthen of Wave will happened since it is totally depended on ratio of it. for example
     Is 50% of Fibonacci overlapped by red color line of BBS middle line? If the ratio of adjustment are less than 50% of it. you should correspond with Box theory if it is more than 50%, you may ensure this wave is not dead and powerful. hence as time goes by let us watch out the movement of candle whether if the candle is resisted by the red line or not, Especially when the stochastic gold signal just like ⑥
     Is stochastic (5.3.3), which we wait for just like ⑥ (gold single)
     Is stochastic triple bottom
At any rate if you are short term trader, take a position in down trend line. Because with daily chart, it is triple top.
Furthermore if you are interested in when it is turning into bullish phase again, please wait for the single of Double tops after whether the previous low line (94.232) is breakthrough or not.


Friday, July 5, 2013

About USD/JPY.

Of USD/JPY.
It is 30min Chart.
See the ①② and recognize that it is 120 ma and 240ma(moving average)
And fully comply with the trend line without any rebellion
As you noticed, no sooner had the Mas converged into the trend line ③ than the candles was up as likely as rocket
However
For the readers of long terms investor, I would like to advise you to keep going on it and companying with trend but to alert the previous higher point, 103.405Yan.

If the 103.405Yan is breakout as a new record, the Wave is not dead      


Friday, April 26, 2013

Shall we trace what happen to USD/JPY since March 8?


Do not be fretting from any news but go for your way and only your way 
You may be a mushroom millionaire if you keep it


Think about the meaning of “Breakthrough the previous higher point”
I will be back according with a fat wallet
Good luck
Your Odyssey Lee    


Anyone a mushroom millionaire has become?
I don’t think so
Few investors can get profit from this usual opportunity lest they should be truly chart professional list.

Tomorrow is too late to study for analyzing the chart language
Today do it what chart is twitting, ingratiating and insinuating to you     


However
The above article had been written March 8
Today it is May 30, 2013
Shall we trace what happen to USD/JPY since March 8?


  Is the price of march 8 (94.872 Y)
  Is the highest price of its duration   
  Is price 98.038 Y of today may 26
  Is the gap  5.10% between march 8 (94.872 Y) and its peak point 99.800
5% is not so much profit to be enough  a mushroom millionaire but you may realize the power of chart language
Bong voyage!
Your Odyssey  

Friday, March 8, 2013

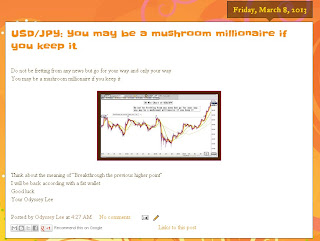
USD/JPY: You may be a mushroom millionaire if you keep it


Do not be fretting from any news but go for your way and only your way 
You may be a mushroom millionaire if you keep it


Think about the meaning of “Breakthrough the previous higher point”
I will be back according with a fat wallet
Good luck
Your Odyssey Lee    

Sunday, February 10, 2013

actual fluctuated (92.177~94075) USD/JP she said (91,314~93,820)


Do you remember what  Cassandra Said ?
It will be Fluctuated between (91,314~93,820) Yen (2.22%) of a week

however 
How much has it been difference from her before and after?
How much has it actually been fluctuated?
Let us checkup?
It has been actually fluctuated (92.177~94075) USD/JPY
But she said (91,314~93,820) USD/JPY

Can you notice the difference for weekly prediction?
A little bit error is forgivable, if we are talking about big wave such as weekly prediction
It might be more precisely predicted if she is asked such as daily or hours one


Anyway
I would like to warn you that the TREND should be shaded way since we have been enjoy it too much

About this week prediction of fluctuation I would like to be silence because it is confronted with meaningful point which is 91,314 Yen.USD/JPY

According to this pivotal point I wish you to make plan for weekly project and wish you to remember the Wave theory of TREND

Bon voyage  
Written in Sunday, February 10, 2013
Odyssey Lee      


Wednesday, February 6, 2013

Cassandra said yesterday


Cassandra said yesterday “It is a long lane that has no turning” or “The ebb and flow”
Was it a peak in shorter view of trading?
Cheer up!  


====
Reminders!
It is real time live show
I wish you to check it posted Korean and chart time
And wish you to review from oldest posted Chart because it is reversely list up.
Thanks
Yours Odyssey Lee  

Tuesday, February 5, 2013

It is the after of Cassandra USD/JPY


Do you remember Before of Cassandra? 


it will be Fluctuated between (91,314~93,820) Yen (2.22%) of a week


Here 
it is the  after of Cassandra USD/JPY 
it has been reached at 94.040 which is a little bit higher than she calculated 
I think it is allowable due to  Weekly Prediction  

Hence you have to prepare to ensure the profit cut since we agree with  “there are lane with no curve”
Let us see the chart about posted time and reported time 


Sunday, February 3, 2013

Can it be touched upon 1,43422 of previous higher point?


Can it be touched upon 1,43422 of previous higher point?  
Yes 
I should be at least  rebounded up to 1,43422
however
please compare the items of USD/JPY
then I think you can come to it


this information never be useful for long terms view trader
but scalpers

because it is 30 minute chart of Wave inflection

Do not be shy to tell me what time frame chart you want to know

it is totally up to time frame chart regardless of methodology

the skill is the same but only time frame chart is different

it means
if you can predict  30 minute  chart
you must predict daily weekly monthly chart even millennium chart

just give me any chart  I will tell you according as time frame  

it will be Fluctuated between (91,314~93,820) Yen (2.22%) of a week


As I mentioned before “issue and making a sense” there are two things.
One is obvious of UPTREDN of USD/JPY
The other one is “issue and making a sense” against the obvious one

Obey the obvious things do not play with “issue and making a sense” Unless you are Cassandra

I wish you not to follow Cassandra words instead of keeping going on “UPTREND”  


Nevertheless Cassandra wants to be a freak and geek
For it is attracting people’s attention because it is interesting    
Here is “the issue and making a sense” of inflection of a week
She said that it will be Fluctuated between (91,314~93,820) Yen 
Percentage (2.22%) of fluctuation of a week

Let us see a week later again whether if she can be enough to be a freak and geek or not

Bog voyage 

Tuesday, January 29, 2013

What is omen for this (USD/JPY) processing?

What is omen for this (USD/JPY)  processing? 

Is it going for 91.243 Yen (USD/JPY) which is predicted by Cassandra on monday?
If so!

What is best strategic?
I think all men can handle with this information

Bon voyage!

Yours Odyssey Lee  


To Korean

이번주 월요일 제가 예상치 글을 올려 놓았지요?

차트에 찎혀 있는데로 "Hence it should be fluctuated between (91.243~88.461) within 1 week" 입니다

그러면 우리는 이 녀석은 지금 어리로 가고 있는 것일까요?
91.243 Yen?

만약 이것이 사실이라면, 팔려고 작전을 구사했던 사람은 어디서 잘못 되였을까요?

(91.243~88.461) 사이에 등락이 된다는 정보를 가공하지 못해서?
아니면 저의 글을 못 믿어서 ?