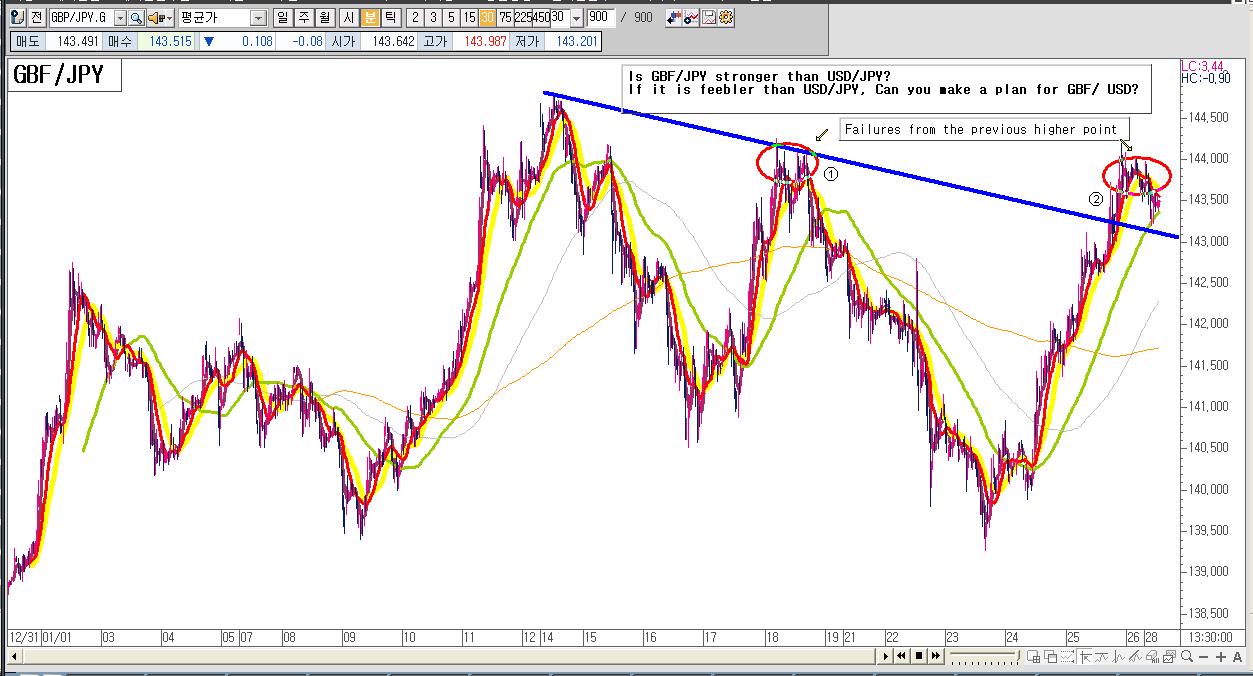
Can it be touched upon 1,43422 of previous higher
point?
Yes
I should be at least rebounded up to 1,43422
however
please compare the items of USD/JPY
then I think you can come to it

this information never be useful for long terms view trader
but scalpers
because it is 30 minute chart of Wave inflection
Do not be shy to tell me what time frame chart you want to know
it is totally up to time frame chart regardless of methodology
the skill is the same but only time frame chart is different
it means
if you can predict 30 minute chart
you must predict daily weekly monthly chart even millennium chart
just give me any chart I will tell you according as time frame